After installing Citrix XenApp/XenDesktop roles such as StoreFront, Delivery Controller, VDA on servers, the setup installation adds several new performance counters that you can access and use via Performance Monitor. Some of the counters will be specific to the role you install so the counters available to each machine will vary.
A regular analysis of performance data not only helps you identify bottlenecks or lack of resource, they also help when it comes to troubleshooting. Good practice would be to collect some performance data after a clean install of XenApp/XenDesktop. You can use this collected data as a baseline to compare future collections. You can also compare it against changes that have been made to the environment to identify what change(s) have had a negative impact on performance.
Lets take a look at some of the useful counters to get a better understanding of what is offered.
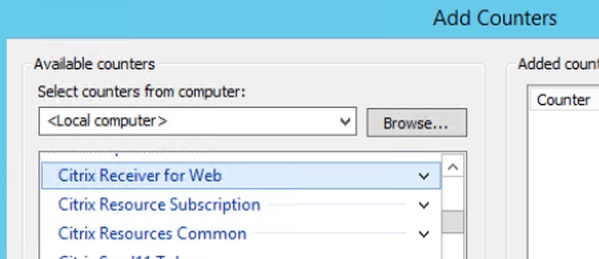
Citrix Receiver for Web
The following counters are found on your StoreFront servers, under the Citrix Receiver for Web grouping.
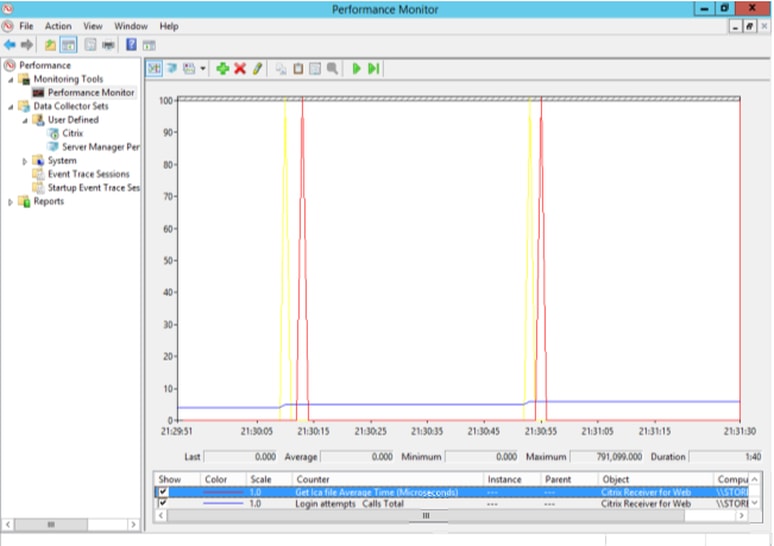
- Get Ica file Average Time (Microseconds) – This counter records the amount of time it takes for an end-user device to receive a generated ICA file when a user requests to launch an application through Receiver for Web.
Knowing the general behind the scenes logon processes once a user makes a request to launch an application will make troubleshooting easier:
- User clicks to launch application, request is forwarded to a Delivery Controller
- Delivery Controller queries SQL to determine the best worker server to host session
- Delivery Controller sends the connection information to StoreFront
- StoreFront create a launch.ica file, sends file to end-user device
- Receiver for Web HTML5 or Receiver client launches ICA file on end-user device. Makes connection request to worker server and executes application
- Login attempts average time (Microseconds) – The amount of time it takes to authenticate and log a user on to Receiver for Web.
- Login attempts call total – The total amount of logins to a Receiver for Web.
Citrix Broker Service
The following counters are found on your Delivery Controller server, under the Citrix Broker Service grouping.
- Brokered sessions – The amount of sessions the Citrix Broker Service has processed/brokered.
- Registration requests – The total amount of requests made by a VDA to initiate registration against the Delivery Controller.
Citrix Database Countes
Most of these counters can be found under several groups, groups such as Citrix Broker Service, Citrix Configuration Logging, Citrix StoreFront etc.
- Database Avg. Transaction Time – Records the average transaction time between the Citrix component and SQL database. An example would be recording the average transaction time between Citrix StoreFront and the SQL database. Another would be recording the average transaction time between the Citrix Broker Service and the SQL database.
- Database connected – Records if the Citrix component being monitored is connected to the database, or if it loses connection. Value 1 for yes, value 0 for no. This can be useful to prove if the database and Delivery Controller or Provisioning Services for example experiences frequent disconnects.
- Database Transactions/sec – Records the amount of transactions per second. This counter is available for several services such as the Configuration Logging Service and Citrix Broker Service.
- Database Transaction Errors/sec – Records the number of failing transactions per second.
Citrix Profile Management
When you install the VDA component on a machine, you get Citrix Profile Management counters.
- Logoff duration – The total time in milliseconds it took to logoff.
- Logon duration – The total time in milliseconds it took to logon.
- Logon bytes – The amount of data in bytes transferred during the logon process.
- Delete Local Profile Duration – The amount of time it took to delete a local profile. When using Citrix Profile Management you get the option to delete user profiles after that user has logged off their session. This is a good practice to reduce HDD bloat, especially when machines are shared between users in XenApp.
Sorry for the lack of pictures but you wouldn’t get a whole deal of interesting information from them. As expected, a fresh install would produce very low results. Go ahead and start gathering baselines. Even if your environment is in full production, it will still change through time and likely increase in size so it is never too late to capture performance data.
Citrix Delegated Explicit Authentication
Found on StoreFront servers.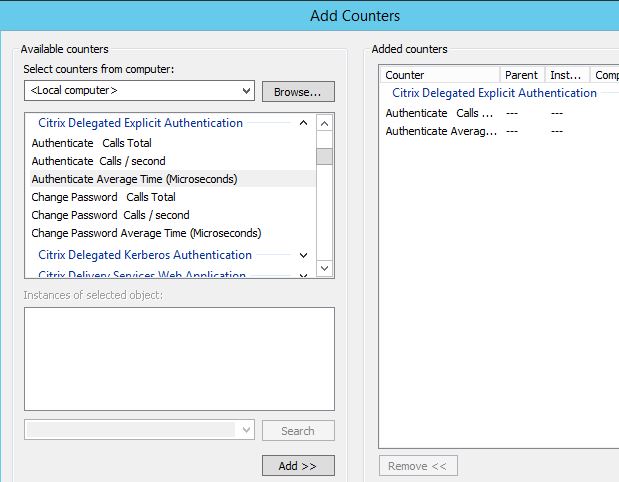
- Auhenticate Calls Total – This counter counts the total number of explicit logons to Web Interface or the Receiver client. Explicit means the user name and password is manually entered. SSO/domain passthrough is not evaluated/counted. This counter is specific to each StoreFront server it is ran on. There is an Entry Count counter within the Citrix Credential Wallet counter group which will captures the same logon count information but has the same equal value across all StoreFront servers, which doesn’t give a true indication of how many logons each server processed in a load balanced setup. Statistics clear when the Citrix Default Domain Services service is restarted.
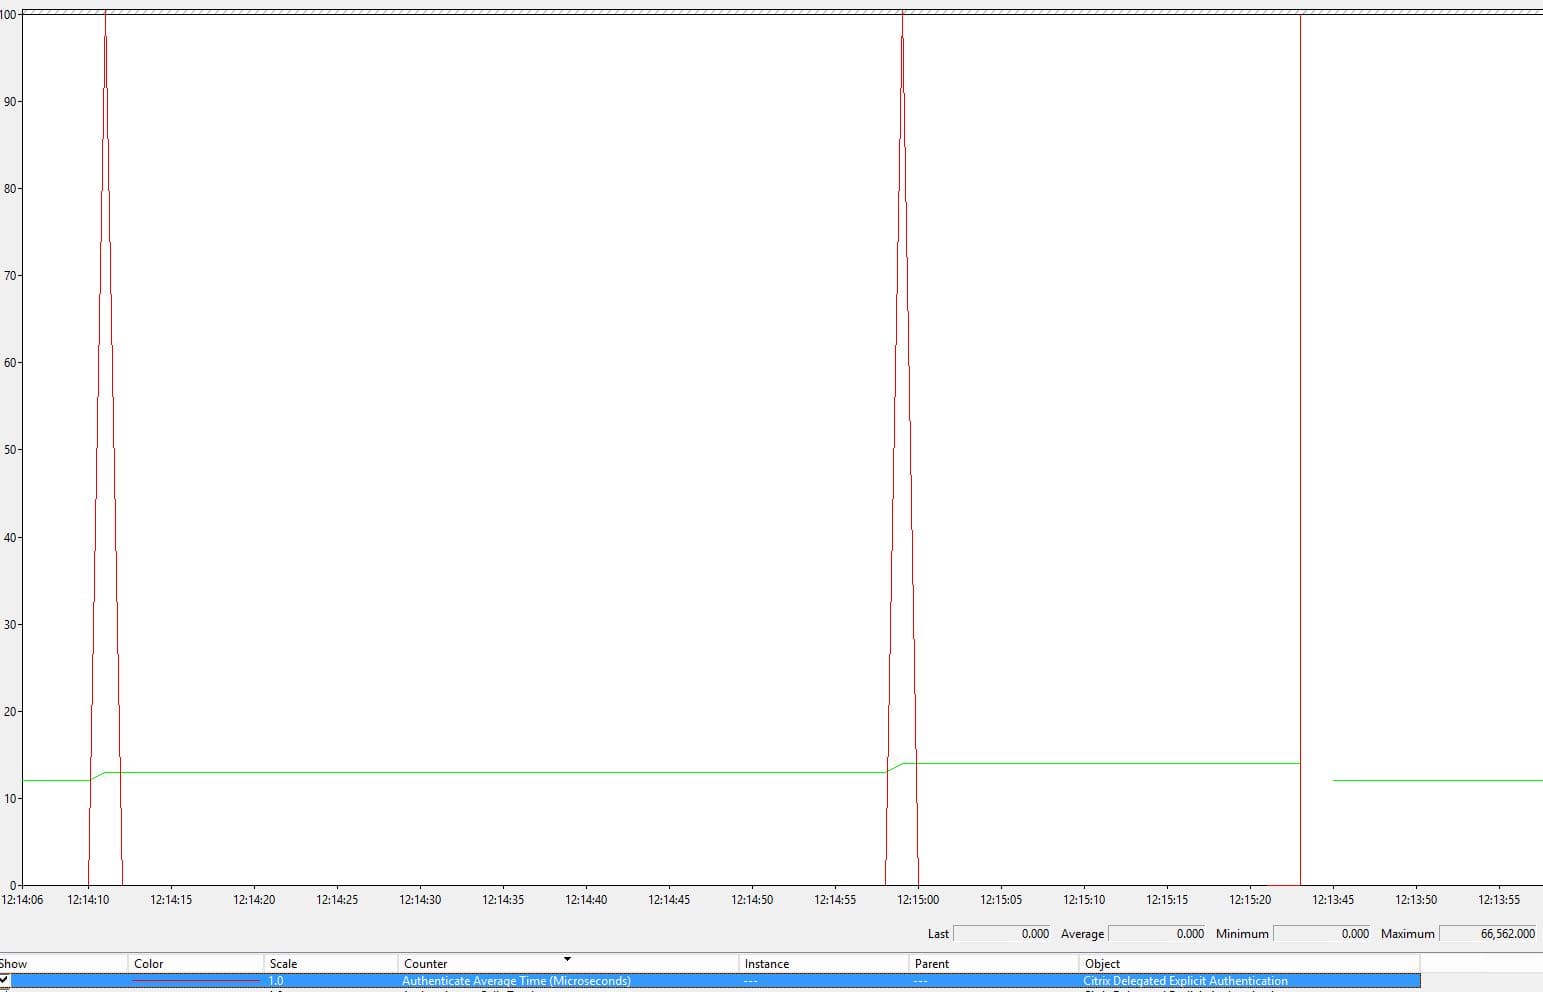
- Authenticate Average Time (Microseconds) counts the average time taken to log a user on to Receiver for Web or the Store using Citrix client.

Citrix Resource Subscription
Found on StoreFront servers.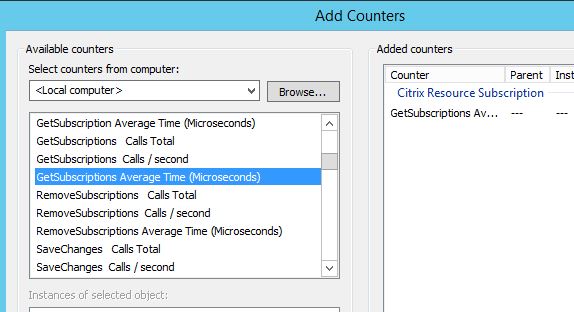
- GetSubscriptions Average Time (Microseconds) – This counter records the time it takes for a users resource subscription to gather when using Citrix Receiver and logging on or refreshing apps or logging on to Receiver for Web.

All performance counters noted here https://support.citrix.com/article/CTX220619